

As the saying goes, two seemingly contradictory things can be true.
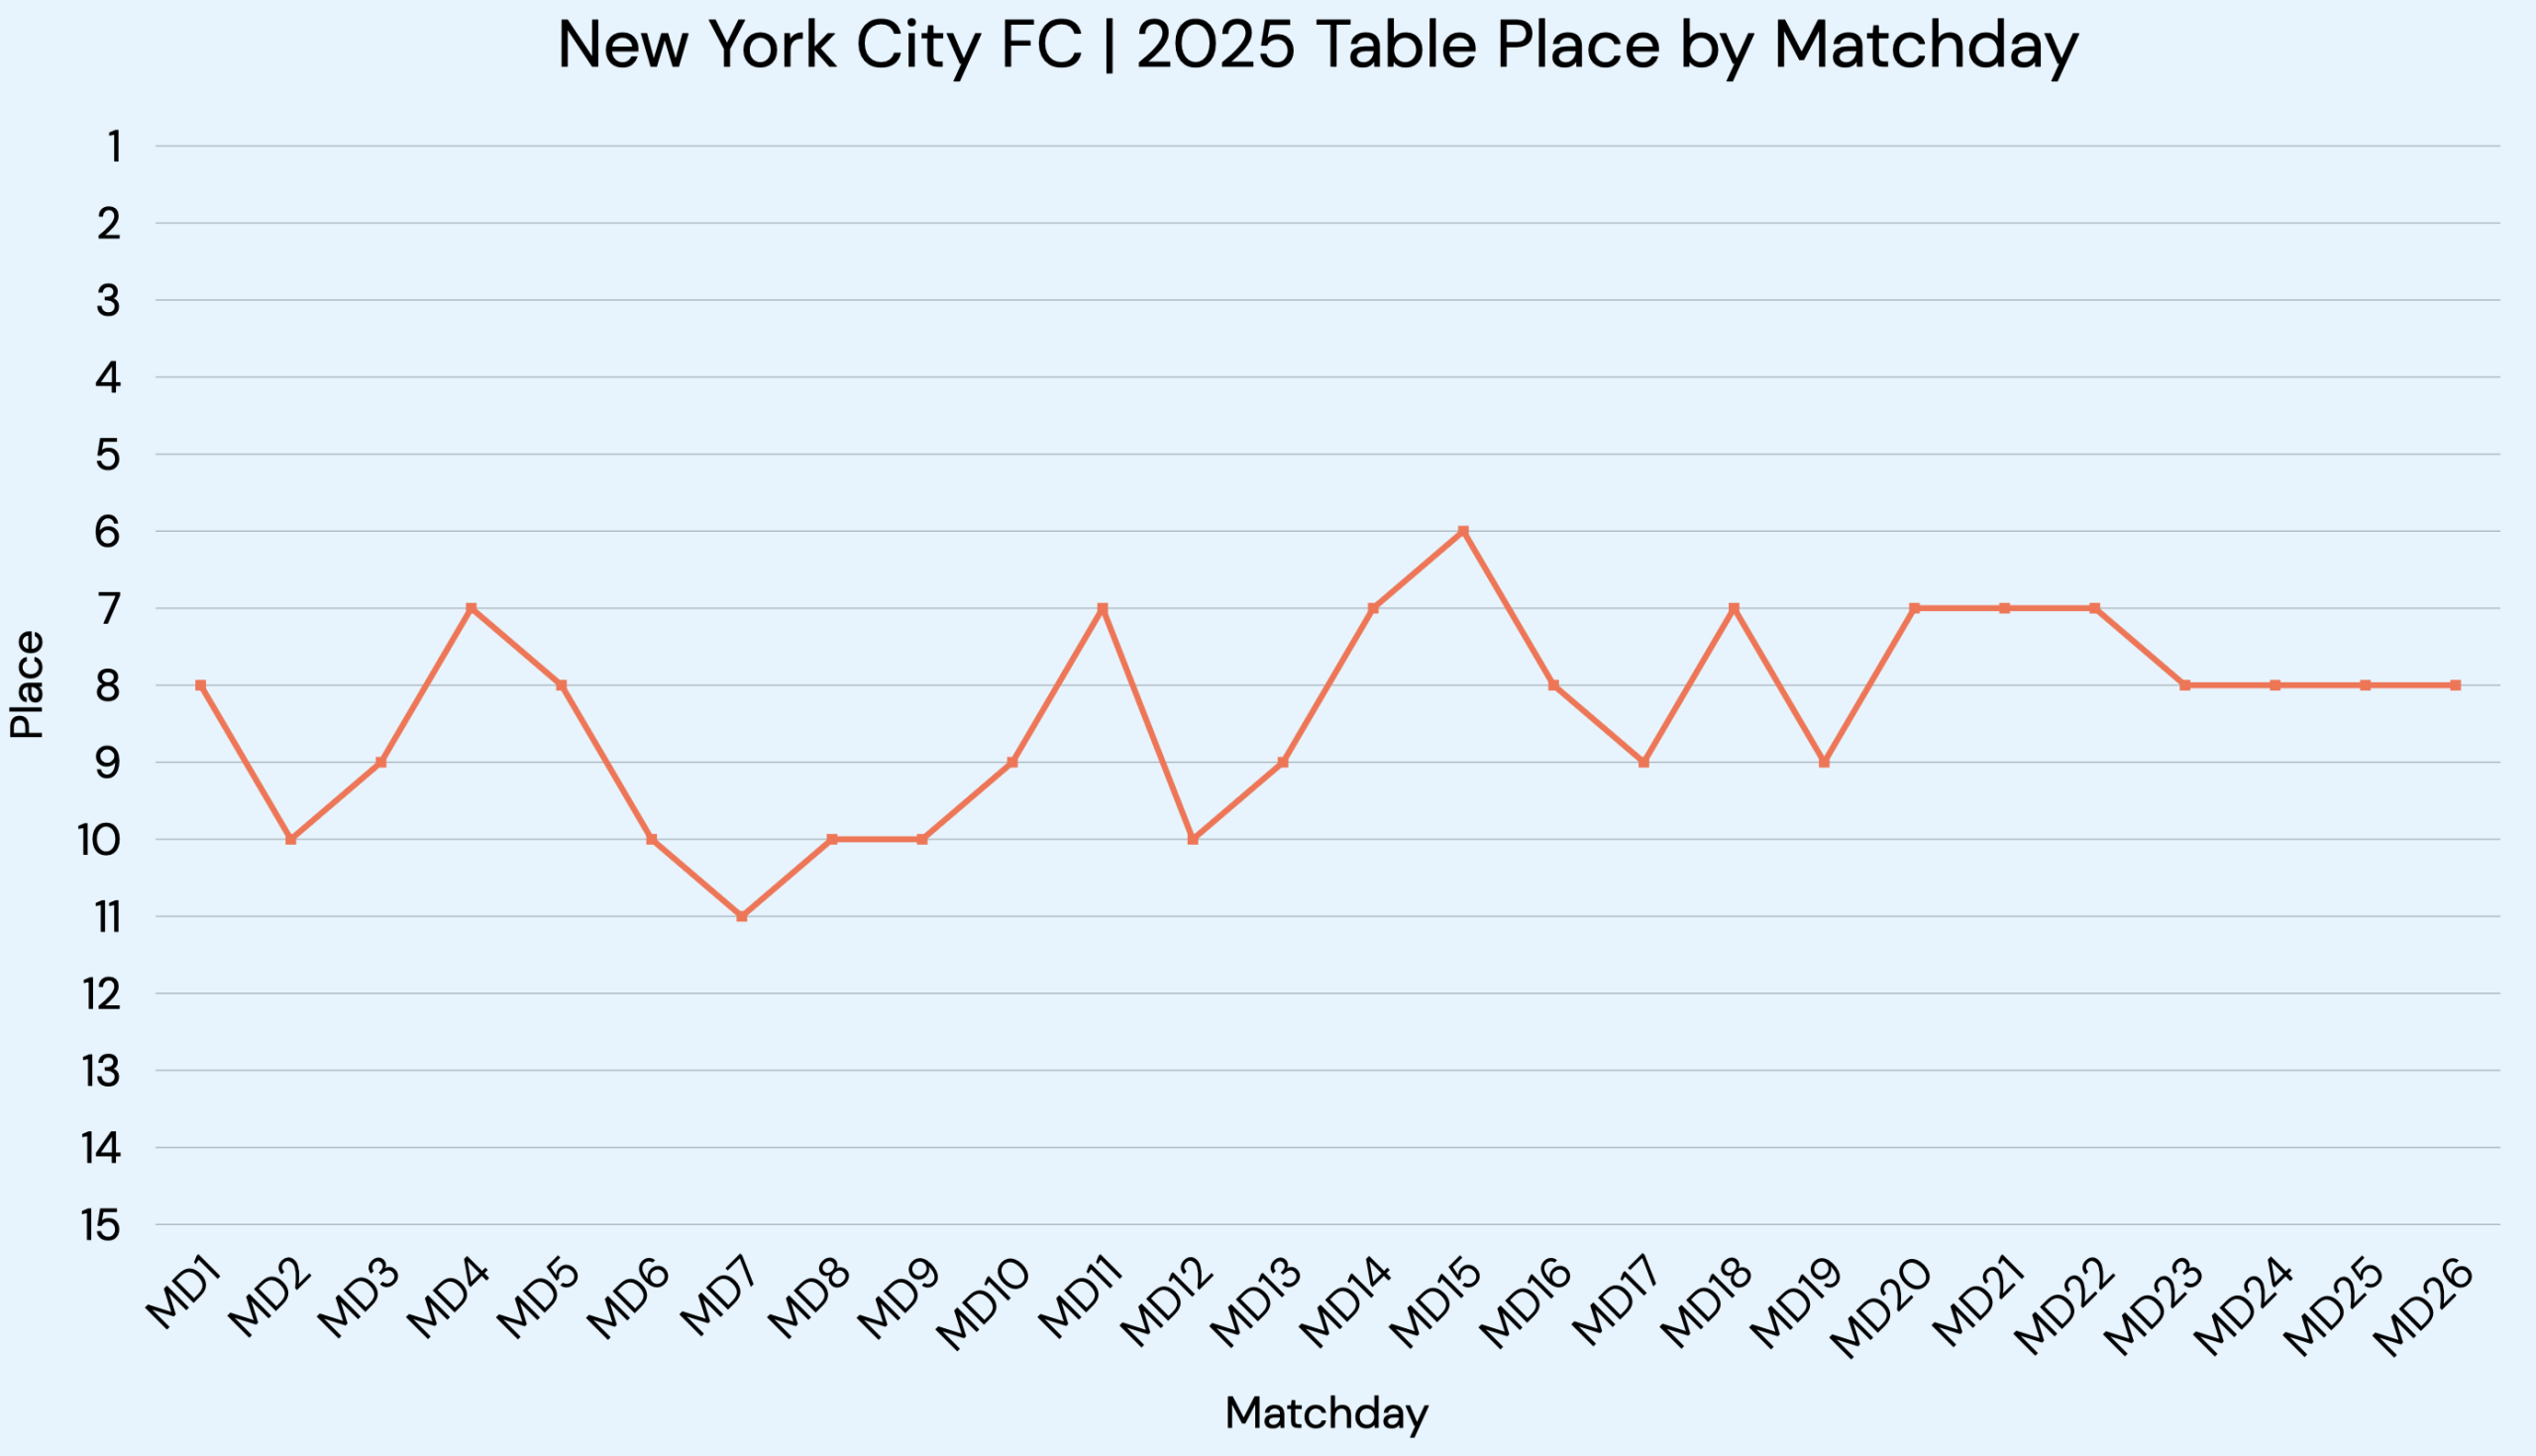
For example: New York City FC’s four wins and one draw in five games make them one of the hottest teams in Major League Soccer, and yet they have remained stuck in 8th Place in the Eastern Conference since July 19.
New York City have taken 13 out of a possible 15 points in those games, second-best in the league behind Charlotte FC’s 15. And yet the team simply can’t translate those results into a higher position on the table.
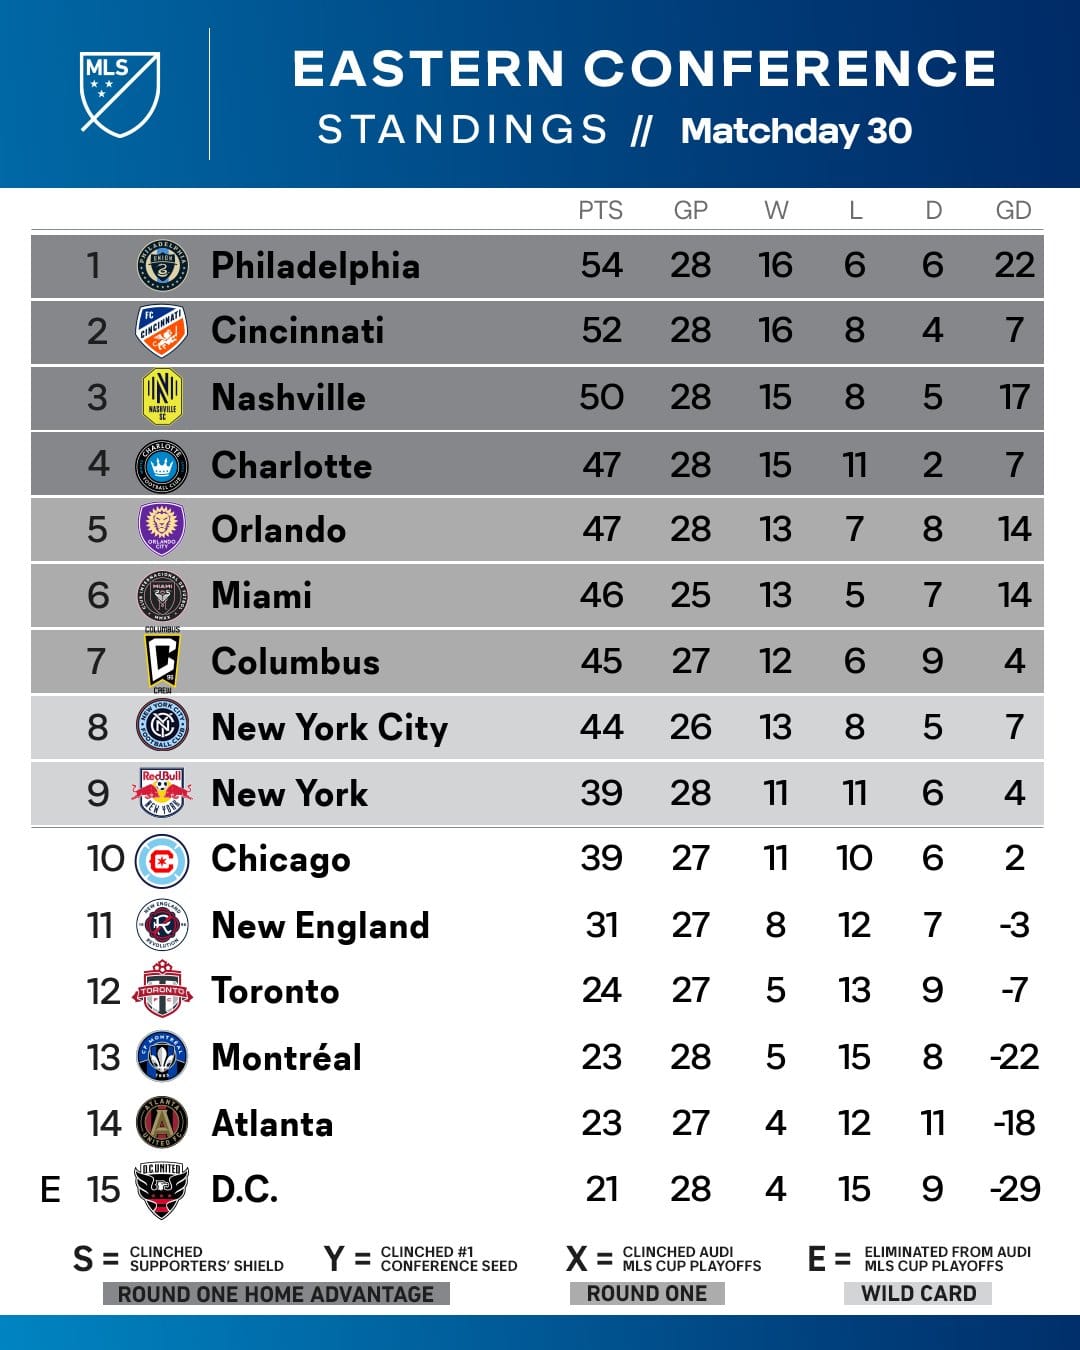
That could be cause for concern in an Eastern Conference that’s unusually competitive this year. NYCFC currently sit in 8th Place with 44 points after 26 games. In any other season, 44 points would be enough to all but guarantee a playoff spot — just look at 2024 and 2023, when the 8th-Place team finished with 43 points total. But this year, it might take 55 points to finish in 8th Place, the most in the history of the league. A point total that usually would be good for 4th Place, and home-field advantage in the First Round of the postseason, instead might place you in the Wild Card matchup.
But if you open the aperture a little and look at the bigger picture, you’ll see that New York City’s current run of form puts them in a strong position to move up the table as the season draws to a close — and build the momentum required of any team looking to make a deep run in the MLS Cup Playoffs.
1. The top of the Eastern Conference is tighter than a…
To better understand how competitive the East is this year, just compare it to the West. If New York City were in the Western Conference, their 44 points and 13 wins would put them in 4th Place, ahead of Seattle Sounders.
Instead, NYCFC are straining to move above the East’s two Wild Card spots. Both New York Red Bulls (39 points, 9th Place) and Chicago Fire (39 points, 10th place) lost over the weekend, putting some space between NYCFC and those teams, but the fact remains that one of these three teams likely will miss the playoffs.
At the same time, NYCFC are just three points off Charlotte in 4th Place, with two games in hand. Even 3rd Place is within reach, as New York City are six points behind a Nashville SC that continue to stumble.
2. Tough competition between in-form teams
First, the good news: New York City are among the league’s most competitive teams when it comes to current form. As you can see from the table below, the club’s near-perfect record in the last five games played puts them above the season’s powerhouses, such as San Diego, Philadelphia, FC Cincinnati, and Inter Miami. (You’ll find a complete league table at the end of this post.)
MLS | Form Guide: Top 5 Teams*
| Team | W | D | L | PTS | PPG | GF | GA | GD | H/A | |
|---|---|---|---|---|---|---|---|---|---|---|
| 1 | Charlotte FC | 5 | 0 | 0 | 15 | 3.0 | 8 | 2 | 6 | 3/2 |
| 2 | New York City FC | 4 | 1 | 0 | 13 | 2.6 | 10 | 6 | 4 | 1/4 |
| 3 | Orlando City | 4 | 0 | 1 | 12 | 2.4 | 13 | 9 | 4 | 2/3 |
| 4 | San Diego FC | 3 | 2 | 0 | 11 | 2.2 | 6 | 2 | 4 | 3/2 |
| 5 | Seattle Sounders | 3 | 1 | 1 | 10 | 2.0 | 14 | 7 | 7 | 2/3 |
* Last 5 games through August 25, 2025
Now for the bad news: The league’s other in-form teams are Charlotte and Orlando City, NYCFC’s direct competition in the East. That goes a long way to explain why New York City remain in 8th Place despite winning four out of the last five — NYCFC might be adding points, but so are Charlotte and Orlando.

3. Games in hand
NYCFC’s postponement of the game vs Columbus earlier this month due to the poor condition of the grass at Citi Field also contributed to the club’s stagnation on the table. New York City have played just 26 games, which is one or two fewer than every other team in the East except for Miami, which played 25.
If you go by overall points per game, New York City (1.69 ppg) would be in 5th Place, behind Nashville (1.79 ppg) and just above Charlotte and Orlando (1.68 ppg each).
But having one, two, or three games in hand isn’t the same as having the points. Nashville definitively have 50 points after 28 games, while Charlotte and Orlando have 47 points. NYCFC’s current run of form indicates that they should have 48 points after 28 games, but that’s just theoretical.

4. Chemistry takes time
Aiden O’Neill joined NYCFC on April 25, and made his first start on May 10 in Matchday 12. He looked comfortable from day one, but it wasn’t until recently that he emerged as one of the team’s key players. His two most recent performances were particularly impressive: Not only did he help shut down two of the league’s best No 10s in Nashville’s Hany Mukhtar and Cincinnati’s Evander, but his knack for recovering the ball and immediately launching an attack led to two game-winning goals.
The NYCFC believers are starting to notice. O’Neill earned his first Player of the Match honor after Saturday’s road win over Cincinnati, taking almost 70% of the vote.
Will Nico Fernández follow a similar trajectory? He was signed on July 11, and made his debut two weeks later in Matchday 24. Nico is now four weeks into his playing time with the club, and has another nine weeks of the regular season left. Are we starting to see him build on-field chemistry with Alonso Martínez, Maxi Moraelz, Andrés Perea, Hannes Wolf, and the rest of the squad?
In the meantime, the rest of the team continues to improve dramatically. After Perea left Saturday’s match in the first half with an injury, Jonny Shore stepped in and provided continuity in the midfield: He looked like a veteran starter, not an 18-year-old subbing in against one of the best midfields in the league.
Will others on the bench start to make their mark? Agustín Ojeda has played in all 26 of the team’s league games this year — he has head coach Pascal Jansen’s trust, and he’s starting to make goal contributions, but he remains inconsistent. Julián Fernández is looking better than he did at the start of the season, but he has yet to have the impact he made last year. If one of these players starts to produce, then an already good attack will become even better. Add to that a Nico who starts to live up to his Designated Player contract, and the team suddenly looks extremely potent.

5. 37 Goals scored, 30 allowed
If there are two numbers that reveal NYCFC’s position in the league right now, it’s goals scored and goals allowed.
New York City’s 37 goals scored place them #10 in the East, and #18 overall. That mediocre offensive output is more in line with what you see from the teams that will miss the playoffs this year, and far behind the league-leading 54 goals from Inter Miami and Orlando.
Can New York City’s offense find a higher gear? The 10 goals scored in the last five games are a good sign that the attackers are starting to thrum, especially when you consider that four of those were played on the road. To put that in perspective, NYCFC have scored 16 goals on the road so far this season: Eight in their last four matches, and eight in the previous ten.
On the other end of the field, New York City’s 30 goals allowed make them #2 not just in the East, but in the entire league. Only Philadelphia’s 26 goals allowed are better.
That number is the product of a defensive unit that is tough to break down despite being patched together by Jansen. A back line with Justin Haak playing out of position as the left-side center-back, and that transferred Birk Risa back to Molde FK in Norway, and lost Thiago Martins to injury in the team’s recent wins over Dallas FC and Nashville, is still finding a way to put up results.
New York City FC | MLS Results by Year
| Year | GP | W | D | L | GF | GA | GD | PTS | PPG | PL | Win % |
|---|---|---|---|---|---|---|---|---|---|---|---|
| 2025 | 26 | 13 | 5 | 8 | 37 | 30 | 7 | 44 | 1.69 | 8 | 50.0% |
| 2024 | 34 | 14 | 8 | 12 | 54 | 49 | 5 | 50 | 1.47 | 6 | 41.2% |
| 2023 | 34 | 9 | 14 | 11 | 35 | 39 | -4 | 41 | 1.21 | 11 | 26.5% |
| 2022 | 34 | 16 | 7 | 11 | 57 | 41 | 16 | 55 | 1.62 | 3 | 47.1% |
| 2021 | 34 | 14 | 9 | 11 | 56 | 36 | 20 | 51 | 1.50 | 4 | 41.2% |
| 2020* | 23 | 12 | 3 | 8 | 37 | 25 | 12 | 39 | 1.70 | 5 | 52.2% |
| 2019 | 34 | 18 | 10 | 6 | 63 | 42 | 21 | 64 | 1.88 | 1 | 52.9% |
| 2018 | 34 | 16 | 8 | 10 | 59 | 45 | 14 | 56 | 1.65 | 3 | 47.1% |
| 2017 | 34 | 16 | 9 | 9 | 56 | 43 | 13 | 57 | 1.68 | 2 | 47.1% |
| 2016 | 34 | 15 | 9 | 10 | 62 | 57 | 5 | 54 | 1.59 | 2 | 44.1% |
| 2015 | 34 | 10 | 7 | 17 | 49 | 58 | -9 | 37 | 1.09 | 8 | 29.4% |
| Total | 355 | 153 | 89 | 113 | 565 | 465 | 100 | 548 | 1.54 | 46.5% |
* 23 games were played in 2020
Another way to look at it is through the lens of goalkeeping. Last year, Matt Freese’s heroics saved 8.9 goals per FotMob, but the team’s 49 goals allowed were the third-highest in club history, behind only the hapless Josh Saunders era of 2015 (58) and 2016 (57). This year, Freese has only 2.0 goals prevented per FotMob, but that’s because there are fewer desperate moments that require him to put on his cape and rescue the team.
Instead, Freese has a career-high 7 clean sheets – a statistic that belongs to the entire defense as much as the goalkeeper – which places him #4 on the club’s all-time list. Those clean sheets are an indication of how well the defense is playing this season.
For the most part, this team looks good. The results aren’t just positive, they’re coming from solid performances, and important players who are emerging or returning from injury are compensating for those lost to transfers and surgery. All the lines on the graph are pointing upwards — except for NYCFC’s place on the table. But if things continue on this path, that will change soon, too.
MLS | Form Guide*
| Team | W | D | L | PTS | PPG | GF | GA | GD | |
|---|---|---|---|---|---|---|---|---|---|
| 1 | Charlotte FC | 5 | 0 | 0 | 15 | 3.0 | 8 | 2 | 6 |
| 2 | New York City FC | 4 | 1 | 0 | 13 | 2.6 | 10 | 6 | 4 |
| 3 | Orlando City | 4 | 0 | 1 | 12 | 2.4 | 13 | 9 | 4 |
| 4 | San Diego FC | 3 | 2 | 0 | 11 | 2.2 | 6 | 2 | 4 |
| 5 | Seattle Sounders | 3 | 1 | 1 | 10 | 2.0 | 14 | 7 | 7 |
| 6 | Minnesota United | 3 | 1 | 1 | 10 | 2.0 | 8 | 5 | 3 |
| 7 | Chicago Fire | 3 | 1 | 1 | 10 | 2.0 | 8 | 8 | 0 |
| 8 | Philadelphia Union | 2 | 2 | 1 | 8 | 1.6 | 9 | 4 | 5 |
| 9 | FC Dallas | 2 | 2 | 1 | 8 | 1.6 | 10 | 6 | 4 |
| 10 | Vancouver Whitecaps | 2 | 2 | 1 | 8 | 1.6 | 9 | 6 | 3 |
| 11 | Austin FC | 2 | 2 | 1 | 8 | 1.6 | 11 | 9 | 2 |
| 12 | Inter Miami | 2 | 2 | 1 | 8 | 1.6 | 9 | 7 | 2 |
| 13 | CF Montreal | 2 | 2 | 1 | 8 | 1.6 | 8 | 7 | 1 |
| 14 | FC Cincinnati | 2 | 1 | 2 | 7 | 1.4 | 4 | 4 | 0 |
| 15 | Colorado | 2 | 1 | 2 | 7 | 1.4 | 9 | 11 | -2 |
| 16 | Nashville SC | 2 | 0 | 3 | 6 | 1.2 | 8 | 7 | 1 |
| 17 | LAFC | 1 | 3 | 1 | 6 | 1.2 | 8 | 7 | 1 |
| 18 | San Jose Earthquakes | 2 | 0 | 3 | 6 | 1.2 | 8 | 9 | -1 |
| 19 | New England Revolution | 2 | 0 | 3 | 6 | 1.2 | 6 | 8 | -2 |
| 20 | NY Red Bulls | 2 | 0 | 3 | 6 | 1.2 | 4 | 8 | -4 |
| 21 | Portland Timbers | 1 | 2 | 2 | 5 | 1.0 | 4 | 7 | -3 |
| 22 | Columbus Crew | 1 | 1 | 3 | 4 | 0.8 | 9 | 10 | -1 |
| 23 | LA Galaxy | 1 | 1 | 3 | 4 | 0.8 | 8 | 12 | -4 |
| 24 | Houston Dynamo | 0 | 3 | 2 | 3 | 0.6 | 6 | 9 | -3 |
| 25 | Atlanta United | 0 | 3 | 2 | 3 | 0.6 | 6 | 9 | -3 |
| 26 | Toronto FC | 0 | 3 | 2 | 3 | 0.6 | 2 | 5 | -3 |
| 27 | St. Louis City | 1 | 0 | 4 | 3 | 0.6 | 8 | 12 | -4 |
| 28 | Real Salt Lake | 1 | 0 | 4 | 3 | 0.6 | 4 | 8 | -4 |
| 29 | DC United | 0 | 2 | 3 | 2 | 0.4 | 5 | 10 | -5 |
| 30 | Sporting Kansas City | 0 | 1 | 4 | 1 | 0.2 | 4 | 14 | -10 |


I like where we are. And after the way we just took it to Cincinnati, I’m sure the squad is completely bought in on Pascal’s agenda: 10 games, 10 finals. This could get exciting. Let’s GO.