
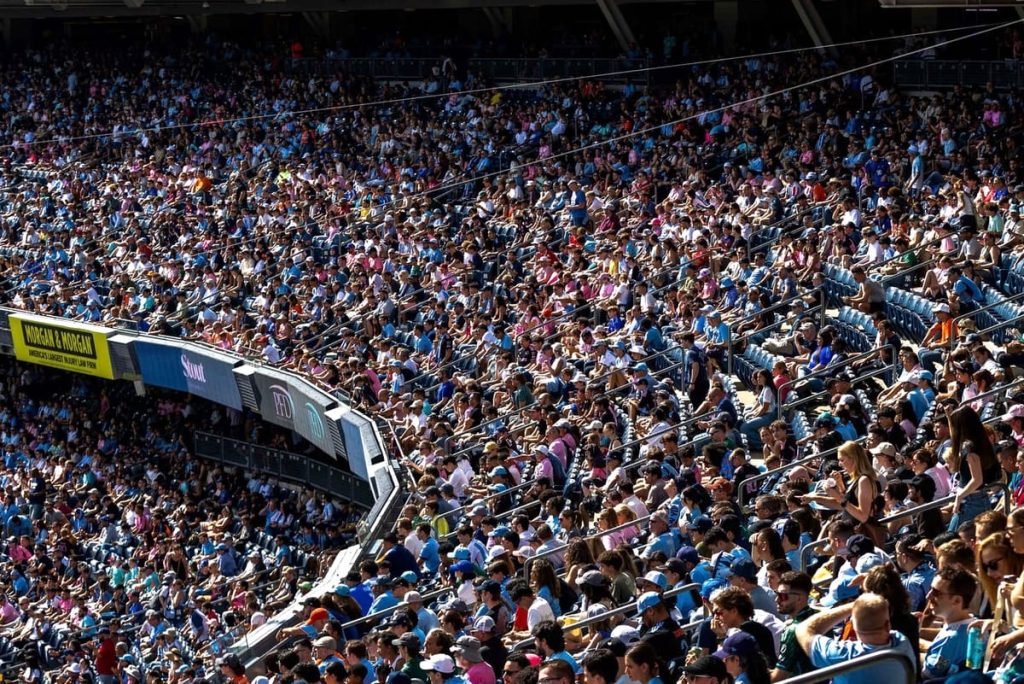
Earlier this week, Major League Soccer announced that a new attendance record was set this season with one regular season game left to play. More than 11 million fans have attended games this year, topping the previous record of 10,900,804, which was set in 2023. According to MLS, the average attendance this year is 23,240 fans per game.
Closer to home, attendance at New York City FC games returned to pre-pandemic levels. In fact, the 21,764 per game average in 2024 is the highest since 2018, surpassing the 21,107 per game average in 2019, when the team enjoyed their best regular season record in club history and finished first in the Eastern Conference.
The total attendance for 2024 is 369,996, which is the fifth-highest in club history. It’s comfortably ahead of 2018’s total of 358,820.
Considering that Sunday’s 3-1 win over Nashville SC at Red Bull Arena was New York City’s 17th and final home game of the 2024 regular season, this an opportune time to look back at this year and see how it measures up to previous seasons — and why the climb in attendance isn’t solely because of Lionel Messi.
New York City FC | Attendance by Year
| Year | Avg | Total | Change |
|---|---|---|---|
| 2024 | 21,764 | 369,996 | 9.7% |
| 2023 | 19,842 | 337,306 | 15.5% |
| 2022 | 17,179 | 292,039 | 80.1% |
| 2021 | 9,541 | 152,659 | -54.4% |
| 2019 | 21,107 | 358,820 | -9.1% |
| 2018 | 23,211 | 394,583 | 4.0% |
| 2017 | 22,321 | 379,455 | -17.9% |
| 2016 | 27,196 | 462,336 | -6.3% |
| 2015 | 29,021 | 493,358 |
New York City FC | Sorted Attendance
| Year | Avg | Total | |
|---|---|---|---|
| 1. | 2015 | 29,021 | 493,358 |
| 2. | 2016 | 27,196 | 462,336 |
| 3. | 2018 | 23,211 | 394,583 |
| 4. | 2017 | 22,321 | 379,455 |
| 5. | 2024 | 21,764 | 369,996 |
| 6. | 2019 | 21,107 | 358,820 |
| 7. | 2023 | 19,842 | 337,306 |
| 8. | 2022 | 17,179 | 292,039 |
| 9. | 2021 | 9,541 | 152,659 |
Note: We explain our methodology in the addendum at the end of this post.
1. The Messi Effect
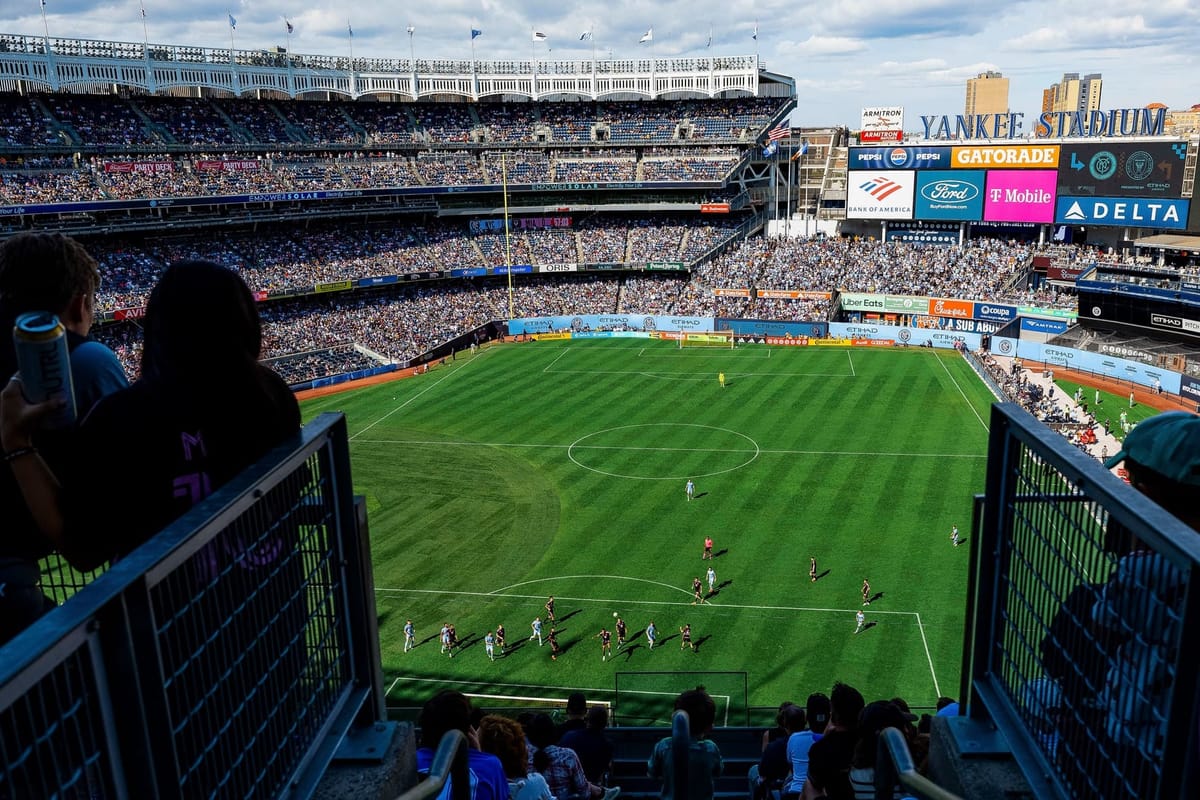
Unquestionably, Lionel Messi helped elevate the numbers across the league and at New York City: The announced crowd of 44,738 who piled into Yankee Stadium to watch NYCFC steal a last-second draw against Inter Miami on September 22 is the second-largest turnout in club history and helped fatten up the season average.
But attendance at NYCFC games was up even for games that didn’t feature Messi & Co. New York City’s 2-1 win over New York Red Bulls at Citi Field drew an announced crowd of 30,731, which makes it the tenth-largest in club history — it was the first time that more than 30,000 fans watched NYCFC play in Queens.
Even if you take the Miami game out of the season’s totals, the average attendance was 20,329 this year. That’s still a 2.5% improvement over the 19,842 average posted in 2023.
New York City FC | Highest-Attended Games
| Date | Opponent | Attendance | |
|---|---|---|---|
| 1. | 6/28/15 | New York Red Bulls | 48,047 |
| 2. | 9/21/24 | Inter Miami | 44,738 |
| 3. | 3/15/15 | New England | 43,507 |
| 4. | 5/21/16 | New York Red Bulls | 37,858 |
| 5. | 8/20/16 | LA Galaxy | 35,509 |
| 6. | 10/25/15 | New England | 34,150 |
| 7. | 7/6/17 | New York Red Bulls | 33,679 |
| 8. | 7/3/16 | New York Red Bulls | 33,613 |
| 9. | 7/26/15 | Orlando City | 32,041 |
| 10. | 5/18/24 | New York Red Bulls | 30,731 |
| 11. | 6/17/23 | Columbus Crew | 30,615 |
| 12. | 9/17/22 | New York Red Bulls | 30,151 |
| 13. | 10/23/16 | Columbus Crew | 30,374 |
| 14. | 7/26/15 | Orlando City | 32,041 |
| 15. | 3/13/16 | Toronto FC | 30,315 |
| 16. | 8/22/18 | New York Red Bulls | 30,139 |
| 17. | 7/8/18 | New York Red Bulls | 30,027 |
| 18. | 8/29/15 | Columbus Crew | 30,018 |
2. Big games delivered big crowds
Two of the season’s traditionally best-attended games returned to pre-pandemic levels.
First, there was the home opener, which was a rainy loss to Portland Timbers on Saturday, March 9. The announced crowd of 24,774 was the fourth-largest in club history, slightly bigger than the 24,489 who watched New York City play Inter Miami last year and the 24,361 who watched the DC United game in 2019. You have to go back to 2018 to find a larger crowd at a home opener.
New York City FC | Opening Day Attendance
| Year | Opponent | Attendance | |
|---|---|---|---|
| 1. | 2015 | New England | 43,507 |
| 2. | 2016 | Toronto FC | 30,315 |
| 3. | 2018 | LA Galaxy | 26,221 |
| 4. | 2024 | Portland Timbers | 24,774 |
| 5. | 2023 | Inter Miami | 24,489 |
| 6. | 2019 | DC United | 24,361 |
| 7. | 2017 | DC United | 24,259 |
| 8. | 2022 | CF Montréal | 21,113 |
| 9. | 2021 | FC Cincinnati | 9,000 |
Second, there was this year’s home edition of the Hudson River Derby, when 30,731 watched New York City win at Citi Field. It wasn’t just the fifth-largest Hudson River Derby home crowd in club history, it was the largest since the heady days of 2015, 2016, and 2017, when New York City still had European megastars on their roster and the stands at Yankee Stadium were packed.
New York City FC | Hudson River Derby Attendance
| Date | Attendance | |
|---|---|---|
| 1. | 6/28/15 | 48,047 |
| 2. | 5/21/16 | 37,858 |
| 3. | 8/6/17 | 33,679 |
| 4. | 7/3/16 | 33,613 |
| 5. | 5/18/24 | 30,731 |
| 6. | 9/17/22 | 30,151 |
| 7. | 7/8/18 | 30,027 |
| 8. | 8/22/18 | 30,139 |
| 9. | 9/16/23 | 29,657 |
| 10. | 8/24/19 | 28,895 |
| 11. | 9/25/21 | 21,212 |

3. Citi Field attendance is up
As we mentioned earlier, that Red Bulls game set a new Citi Field attendance record for New York City, and marked the first time that more than 30,000 watched the team play in Queens. It helped bring up the average attendance at Citi Field in 2024 to 22,566 across six games, which is significantly higher than the 2023 average of 19,289.
New York City FC | Citi Field Attendance
| Year | Avg Att | # Games | |
|---|---|---|---|
| 1. | 2024 | 22,566 | 6 |
| 2. | 2017 | 20,113 | 1 |
| 3. | 2023 | 19,289 | 6 |
| 4. | 2022 | 16,759 | 4 |
4. Red Bull Arena attendance isn’t terrible
Maybe most surprising of all, attendance at Red Bull Arena is also up. The unwelcome third “home” for New York City hosted just two league games this year. One was a midweek matchup, which is never popular in the league, the other an unusual Sunday afternoon game held just four days later.
But they were two of NYCFC’s best-attended Red Bull Arena games — at least on paper. An announced crowd of 10,785 for New York City’s game against FC Cincinnati on Wednesday, October 2, strains credulity, but that’s the official count. Ditto the 13,409 who were supposedly in the stands for NYCFC’s win over Nashville SC on Sunday, October 6 at 4 pm ET.
Still, they are among the three best-attended Red Bull Arena “home” games in club history — the only game that keeps pace is the 2-1 win over Orlando City on October 2, 2022, which had an announced crowd of 13,169. Both this season’s Nashville game and that Orlando game in 2022 were New York City’s final home games of the regular season, which might have helped bump up those numbers ever-so-slightly.
New York City FC | Red Bull Arena Attendance by Year
| Year | Avg Att | # Games | |
|---|---|---|---|
| 1. | 2024 | 12,097 | 2 |
| 2. | 2022 | 9,932 | 3 |
| 3. | 2023 | 8,669 | 1 |
| 4. | 2021 | 3,622 | 8 |
5. New York City ranks 14th in MLS
According to numbers published by Transfermarkt, New York City are 14th in MLS attendance through Matchday 33.
While Transfermarkt isn’t an official source for MLS attendance, their number for New York City’s average is 21,668, which is close to the 21,764 we calculated.
MLS | 2024 Attendance*
| Club | Avg | Total | |
|---|---|---|---|
| 1. | Atlanta United | 49,351 | 838,967 |
| 2. | Charlotte FC | 35,634 | 605,783 |
| 3. | Seattle Sounders | 30,377 | 486,024 |
| 4. | New England | 30,533 | 516,006 |
| 5. | Nashville SC | 28,587 | 485,980 |
| 6. | Vancouver Whitecaps | 26,572 | 425,146 |
| 7. | LA Galaxy | 25,880 | 439,980 |
| 8. | Toronto FC | 25,681 | 436,582 |
| 9. | FC Cincinnati | 25,265 | 429,509 |
| 10. | St. Louis City | 22,433 | 381,358 |
| 11. | Portland Timbers | 22,036 | 352,580 |
| 12. | LAFC | 21,991 | 351,859 |
| 13. | Orlando City | 21,963 | 351,404 |
| 14. | New York City FC | 21,668 | 346,686 |
| 15. | Chicago Fire | 21,473 | 343,570 |
| 16. | Sporting Kansas City | 21,193 | 360,279 |
| 17. | Inter Miami | 20,966 | 335,463 |
| 18. | Austin FC | 20,738 | 330,353 |
| 19. | Columbus Crew | 20,658 | 330,535 |
| 20. | Real Salt Lake | 20,291 | 324,659 |
| 21. | CF Montréal | 19,619 | 313,904 |
| 22. | Minnesota United | 19,579 | 313,262 |
| 23. | FC Dallas | 19,094 | 305,509 |
| 24. | Philadelphia Union | 18,835 | 301,353 |
| 25. | DC United | 18,061 | 288,968 |
| 26. | San Jose | 17,501 | 297,509 |
| 27. | New York Red Bulls | 17,150 | 274,392 |
| 28. | Houston Dynamo | 16,653 | 266,445 |
| 29. | Colorado Rapids | 15,181 | 258,085 |
* Not including Decision Day
A mid-table attendance figure for a team that splits their time between Yankee Stadium, Citi Field, and Red Bull Arena? That feels about right.
Methodology:
- We painstakingly complied the NYCFC attendance numbers from the official match reports on file with MLS. (You can view those numbers here.) While they might differ from the numbers you see published elsewhere, we feel that they are the most accurate figures available.
- Those official numbers reflect tickets sold, not bodies in seats. Anybody who saw Sunday’s game against Nashville at Red Bull Arena will tell you that nothing close to the announced attendance of 13,409 was in the stands that day. It’s impossible for us to challenge that number, but by always using the official count, we can at least be consistent.
- We don’t include the 2020 season, when COVID limited the number of games played and kept fans out of the stadiums.
- We do include the 2021 season, when capacity was limited early on and New York City played eight poorly attended games at Red Bull Arena. It’s a statistical outlier but is nevertheless a part of the club’s history.
- Only MLS regular season games are factored into these tables and figures. That means no Leagues Cup, MLS Cup Playoffs, US Open Cup, Concacaf Champions Cup, or Campeones Cup games are included.


For as much flack as we catch for not having a soccer stadium yet, we’ve always manage to have a pretty strong attendance record for a city that has a million other things going on at any given point and it’s sports culture has never really been soccer focused. If we got any sort of mainstream sports coverage in NYC we’d probably average over 30K fans.
I think you need to rerun these numbers and exclude any home games that were NOT at Yankee Stadium or Citi Field. How does that change the picture?
You mean the two RBA games this year? The club probably missed out on 19,000 more in attendance between both of them, but that’s speculative. All we can do is report the official numbers.
Do you have the numbers for each game? If so, rerun the average for each season using only Yankee and Citi Field games. That should normalize for seasons with extra RBA games. Any other comparisons across seasons is somewhat deceptive
We have all the numbers here – the link is also in the article.https://docs.google.com/spreadsheets/d/1dfwQwQ4T0FVVD_ppJQUpOZIS7BY8E00Y8bCBCUKqEPA/edit?usp=sharing&ref=hudsonriverblue.com
Thanks. Excluding RBA Games for this season would put us in top 10 for MLS. More appropriate than 14th!